
Plastic injection moulding turns molten polymer into repeatable parts, but precision and tolerance determine whether components assemble correctly and perform as specified. A 0.10 mm dimensional shift can cause visible gaps in consumer housings and binding in moving features. Tight tolerances also control shrinkage variation, which often ranges from 0.4% to 2.0% depending on resin grade and wall thickness. This introduction explains how tolerance choices affect cost, cycle time, and quality outcomes.
Key takeaways
- Precision controls part dimensions; tolerance defines acceptable variation for each critical feature.
- Tight tolerances raise tooling, inspection, and cycle-time costs; specify only where functional.
- Material shrinkage and mould temperature shifts drive dimensional change; design must account for both.
- Gate location, cooling layout, and venting directly affect warpage, sink marks, and repeatability.
- Stack-up tolerances across mating parts determine fit, sealing performance, and assembly yield.
- Process capability checks and in-process measurement reduce scrap and stabilise high-volume production.
What Precision and Tolerance Mean in Plastic Injection Moulding
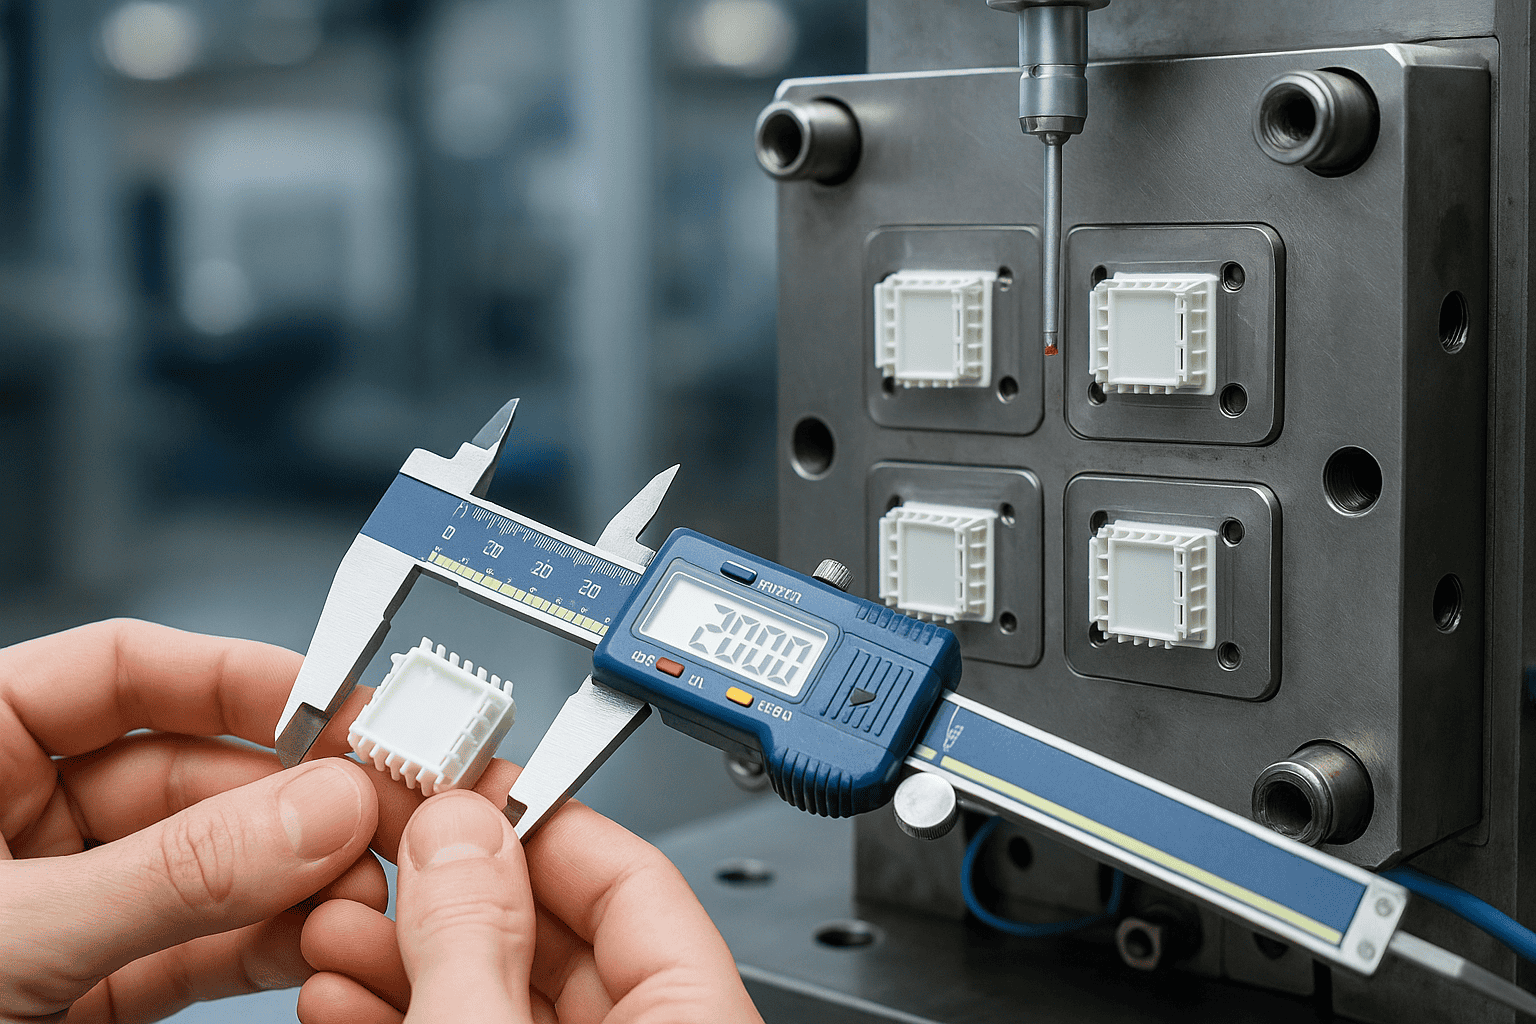
ISO 20457 specifies injection moulding tolerances down to ±0.05 mm for selected features when the part design, tool build, and process control support that capability (ISO). That figure frames what manufacturers mean by precision: the ability to repeatedly hit a target dimension, not merely achieve it once. Tolerance describes the permitted variation around that target, such as 20.00 mm ±0.10 mm, which allows a 0.20 mm total band before a part fails inspection.
Precision and tolerance matter because small dimensional shifts can break fit, sealing, and function. A 0.10 mm oversize on a snap-fit can raise insertion force enough to crack thin walls, while a 0.10 mm undersize on a boss can reduce thread engagement and pull-out strength. Shrinkage adds complexity: many thermoplastics shrink about 0.4% to 2.0% after moulding, so a 100 mm feature can change by 0.4 mm to 2.0 mm if the tool does not compensate.
Teams manage these risks by aligning part requirements, toolmaking accuracy, and process capability. A specialist such as Plastic Injection Moulders typically links tolerance decisions to measurable controls, including cavity steel dimensions, melt temperature stability, and in-process inspection, so the finished parts meet assembly needs at volume.
How Tight Tolerances Affect Part Fit, Function, and Assembly Yield
A medical device housing that snaps onto a PCB often fails for reasons measured in hundredths of a millimetre. If the latch window is specified at 8.00 mm ±0.05 mm, a moulded part at 8.08 mm can prevent full seating, while 7.92 mm can create rattle and intermittent contact under vibration. In a 4-cavity tool, that spread can turn a nominal 98% assembly yield into 92% when operators reject misfits, which equates to 60 extra rejects per 1,000 units.
Tight tolerances force tighter control of shrinkage and warpage, not only tool steel accuracy. A 0.3% change in polymer shrinkage across a 50 mm feature shifts size by 0.15 mm, exceeding many snap-fit limits. Process drift from a 10°C melt temperature swing can produce that change, so manufacturers stabilise temperature, packing pressure, and cooling time and verify capability with Cp/Cpk targets such as ≥1.33.
When parts must interchange across suppliers or lots, tight tolerances protect fit and reduce rework. Standards such as ISO 20457 help align expectations, but assembly yield depends on controlling the full moulding system, not the drawing alone.
Key Drivers of Dimensional Variation: Shrinkage, Warpage, and Process Drift
Mould shrinkage rate ranges (%) for common thermoplastics. Amorphous materials (ABS, PC) shrink less and more predictably than semi-crystalline polymers (PP, PA, POM, LDPE), directly affecting achievable tolerance grades. Source: PlastFabWorks – Injection Molding Shrinkage Guide (2025)
Dimensional variation usually comes from either predictable material behaviour or unpredictable process instability. Shrinkage and warpage follow polymer physics and part geometry, while process drift reflects changes in the moulding window over time. Treating these as one problem leads to over-tight tolerances, unnecessary tool rework, and unstable capability.
| Driver | Typical mechanism | Common magnitude | Most effective control |
|---|---|---|---|
| Shrinkage | Volumetric contraction during cooling and crystallisation | About 0.4–2.5% depending on polymer family | Material selection, mould temperature, packing profile |
| Warpage | Non-uniform shrinkage from temperature gradients and fibre orientation | Often 0.2–1.0 mm on 100 mm parts | Gate location, balanced cooling, rib and wall design |
| Process drift | Shift in melt viscosity, venting, or machine response across runs | 0.05–0.20 mm shifts on critical features are common | Closed-loop control, cavity pressure monitoring, preventive maintenance |
In practice, shrinkage demands correct tool steel offsets, because the polymer will contract by design. Warpage requires geometry and cooling changes, since extra packing rarely fixes differential stress. Process drift needs monitoring and control: NIST highlights that measurement traceability and stable process control underpin repeatable manufacturing, which directly reduces run-to-run dimension shifts. When teams separate these drivers, they choose the right corrective action and protect capability on tight-fit features.
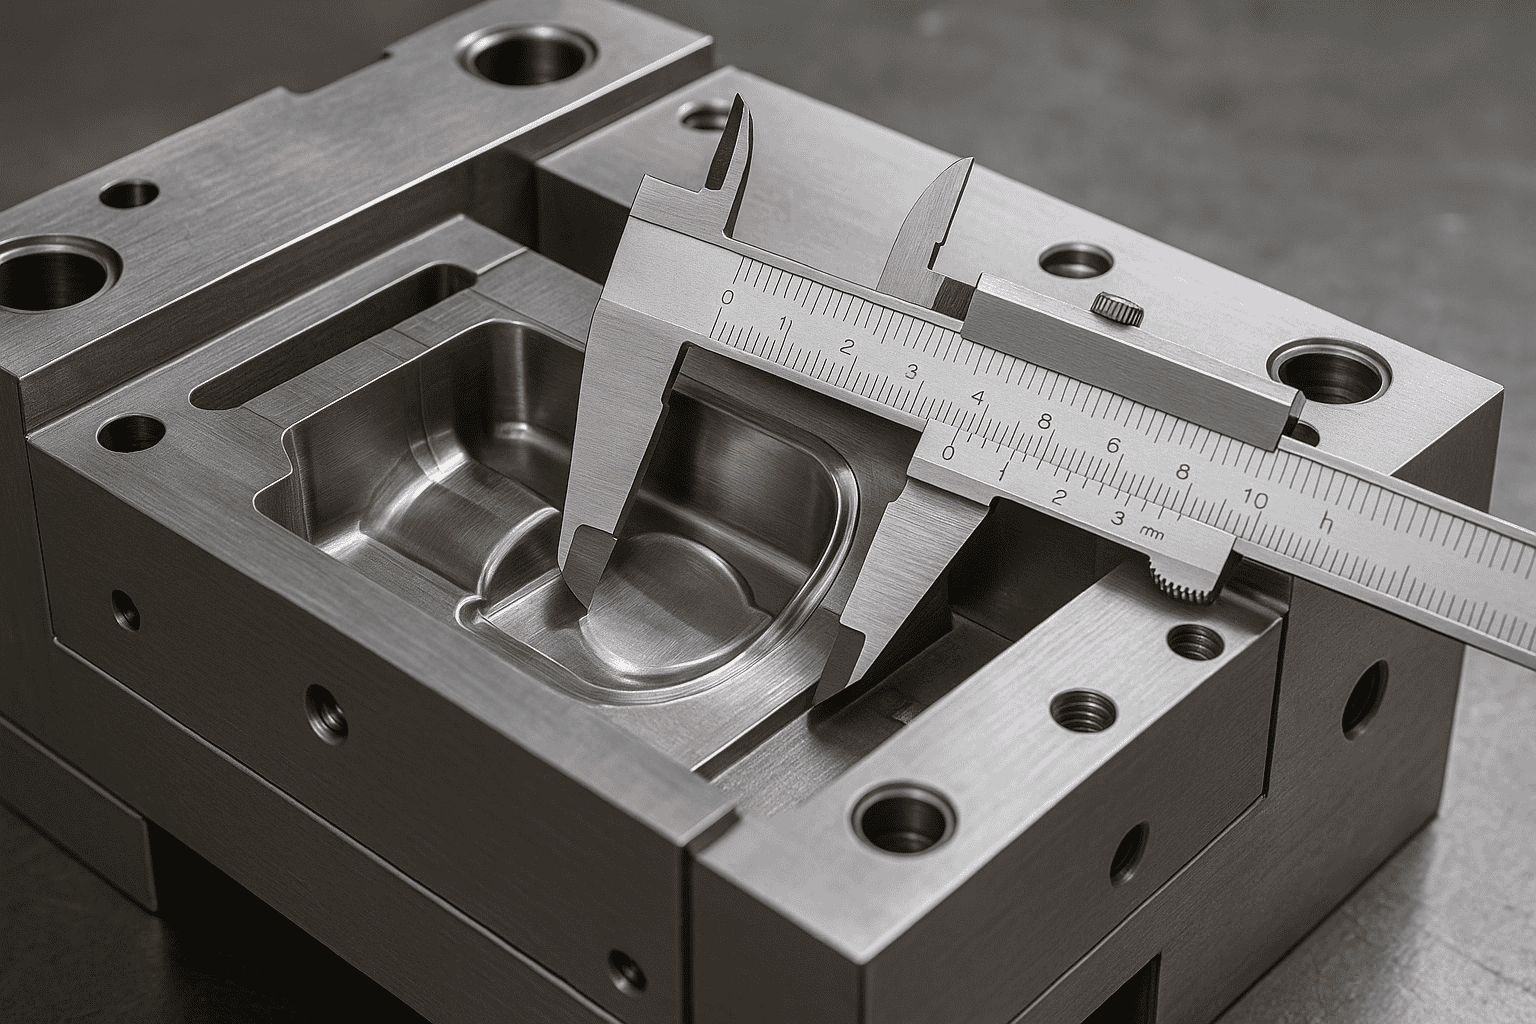
Mould Tooling Accuracy: Machining Limits, Wear, and Maintenance Controls
Tooling accuracy often becomes the hidden constraint when a drawing calls for ±0.05 mm features. A cavity that leaves the tool at 20.000 mm can drift to 20.030 mm after tens of thousands of cycles as sliding surfaces polish, vents clog, and parting lines wear. That shift can push a capable process out of tolerance even when melt temperature and packing pressure remain stable.
The solution is to treat the mould as a controlled asset with defined machining limits, wear allowances, and maintenance triggers. High-precision finishing methods such as jig grinding or wire EDM routinely hold ±0.005–0.010 mm on critical steel features, preserving adjustment range for later correction. Designers also protect accuracy by specifying hardened inserts on high-wear shut-offs and avoiding long, unsupported steel that deflects under clamp force.
Implementation starts with a baseline dimensional map of critical cavity and core features at tool acceptance, then ties that map to a maintenance plan. Many moulders set inspection intervals at 50,000–100,000 cycles for high-volume tools, measuring parting-line mismatch, gate land wear, and ejector pin clearance against pre-set limits. When measurements exceed the trigger, technicians re-lap shut-offs, clean vents to a defined depth, and re-qualify the tool using a short capability run.
These controls reduce unplanned tool pulls and stabilise Cp/Cpk on tight dimensions. Catching a 0.02 mm wear trend early often avoids a full re-cut and keeps assembly scrap from escalating across multi-cavity production.
Material Selection and Its Impact on Tolerance Capability
| Material | Type | Typical Shrinkage Range | Tolerance Capability | Typical Application |
|---|---|---|---|---|
| ABS | Amorphous | 0.4% – 1.6% | Tight (±0.001–0.005″) | Consumer electronics, enclosures |
| Polycarbonate (PC) | Amorphous | 0.5% – 0.8% | Tight (±0.001–0.005″) | Optical housings, medical devices |
| Polypropylene (PP) | Semi-crystalline | 1.5% – 2.5% | Moderate (±0.005–0.010″) | Automotive trims, packaging |
| Nylon / PA | Semi-crystalline | 1.0% – 3.0% | Moderate–Wide | Under-hood automotive, gears |
| Acetal (POM) | Semi-crystalline | 1.5% – 3.0% | Moderate–Wide | Precision mechanical components |
| LDPE | Semi-crystalline | 1.5% – 5.0% | Wide (±0.010–0.020″) | Flexible packaging, caps |
Sources: PlastFabWorks – Shrinkage Calculator Guide (2025); Advanced EMC Technologies (2024)
As of 2024, typical mould shrinkage ranges from about 0.1% to 2.5% across common thermoplastics, which translates to 0.02–0.50 mm of dimensional change over a 20 mm feature (based on material datasheets from DuPont and Celanese). That spread sets the practical tolerance floor before tooling accuracy and process control even enter the calculation. A polymer with 0.5% shrinkage leaves less room for variation than one at 1.8%, because small changes in packing pressure or melt temperature produce larger dimensional swings.
Material selection also affects how consistently a part returns to size after ejection. Semi-crystalline resins often show higher and more direction-dependent shrinkage than amorphous grades, which can widen tolerance bands on long, thin features. Fibre reinforcement can reduce shrinkage by roughly 30–60% versus unfilled resin, but it can introduce anisotropy that shifts critical dimensions between flow and cross-flow directions.
Moisture sensitivity adds another tolerance risk. For example, nylon can absorb around 2–3% water by weight at equilibrium, which can measurably change dimensions and stiffness after moulding. When drawings call for ±0.05 mm, the resin’s shrinkage curve, conditioning state, and reinforcement choice often decide whether capability is realistic.
Process Parameters That Control Repeatability: Temperature, Pressure, and Cooling
A connector cover moulded in PBT may measure 20.00 mm at start-up, then drift to 20.12 mm after two hours, causing a press-fit to seize. The tool has not changed; the process has. A 10 °C rise in melt temperature can reduce viscosity enough to increase cavity fill and raise packing efficiency, which often shifts shrinkage by tenths of a per cent on small features. On a 20 mm dimension, a 0.3% shrinkage change equals 0.06 mm, which can exceed a ±0.05 mm tolerance.
Pressure control drives repeatability because packing pressure and hold time set how much material remains in the cavity as the gate freezes. Many moulders monitor cavity pressure and target a consistent pressure curve rather than a single machine setpoint, since hydraulic losses and screw wear can mask true cavity conditions. Cooling then locks the dimension: a 5 °C change in mould temperature can alter crystallisation rate in semi-crystalline polymers and shift warpage, even when fill and pack remain stable.
When temperature, pressure, and cooling stay within a validated window, the process produces parts that match the tool’s intent cycle after cycle, not just at approval. For parameter definitions and standard terminology, refer to ISO 20457.
Metrology and Quality Assurance: Inspection Methods, GR&R, and SPC
A moulding process can rely on occasional end-of-line checks, or it can use structured metrology that proves capability on every shift. The first approach often detects scrap after it occurs; the second prevents drift by measuring early and acting on evidence.
Option A uses attribute inspection and sparse sampling, such as a go/no-go gauge on one part per hour. Option B uses calibrated dimensional measurement, a documented measurement system analysis, and statistical monitoring. In practice, Option B pairs a CMM or optical system with traceable calibration to NPL standards, then links results to process settings for corrective action.
Three controls drive the difference: method capability, measurement repeatability, and decision rules. A GR&R study separates measurement variation from part variation. Many teams target GR&R at 10% or less for critical dimensions, and treat 10–30% as conditional on risk. SPC tracks stability using control charts, with triggers such as a point beyond 3σ or a sustained run on one side of the mean.
These choices change outcomes. With stable measurement and SPC, a 20.00 mm ±0.10 mm feature can show Cp/Cpk drift before parts fail assembly, reducing tool adjustments and unplanned downtime. For buyers comparing Plastic Part Manufacturers, GR&R results, calibration traceability, and SPC records separate “checked” quality from controlled quality.
| Quality element | Option A: basic checks | Option B: metrology-led QA |
|---|---|---|
| Inspection method | Go/no-go or manual callipers | CMM/optical measurement with traceable calibration |
| Measurement confidence | Unknown measurement error | GR&R quantified (often ≤10% target for critical features) |
| Process control | React after rejects | SPC signals (for example, 3σ limits) prompt early correction |
Design and DFM Strategies to Specify Realistic Tolerances and Reduce Cost
Over-specified tolerances often inflate mould cost without improving function. Applying ±0.05 mm to every dimension can force EDM finishes, extra spotting, and longer try-outs, even when assembly needs only ±0.20 mm on non-mating walls. On a 100 mm feature, a 0.2% shrinkage swing equals 0.20 mm, so chasing ±0.05 mm across the part drives avoidable rework and late ECOs.
Use DFM to allocate tight tolerances only to critical-to-fit features and relax the rest. Define datum schemes around assembly interfaces, then run a tolerance stack-up that links each dimension to a measurable functional requirement. Set material- and geometry-based tolerance floors using shrinkage data from supplier datasheets such as DuPont and validate risk with mouldflow simulation from Autodesk Moldflow.
Implement by adding steel-safe allowances on critical faces, specifying radii and uniform wall targets (for example, 2.0–2.5 mm) to reduce warpage, and agreeing a capability target such as Cpk ≥ 1.33 for key dimensions. This approach cuts tool rework loops and stabilises yield by focusing inspection and process windows on the few dimensions that control fit.
Frequently Asked Questions
What do precision and tolerance mean in plastic injection moulding?
In plastic injection moulding, precision describes how closely a moulded part matches the intended dimensions and geometry, such as holding a 25.00 mm feature within ±0.05 mm. Tolerance defines the permitted dimensional variation, for example ±0.10 mm on a 100 mm length. Tighter tolerances require better tooling, process control, and inspection.
How do tight tolerances affect part fit, function, and interchangeability in moulded components?
Tight tolerances control dimensional variation, so parts assemble with predictable clearance or interference fits and maintain alignment. This reduces leaks, rattle, and binding, improving performance in snap-fits, seals, and moving interfaces. Interchangeability increases because components from different moulding batches meet the same limits, cutting rework and scrap and supporting automated assembly.
Which injection moulding process variables most influence dimensional accuracy and repeatability?
Dimensional accuracy and repeatability depend most on melt temperature (typically 200–320 °C), mould temperature (often 20–120 °C), injection speed, packing/holding pressure and time, and cooling time. Screw back pressure and shot size consistency also matter. A 5–10 °C temperature drift or a 5–15% packing change can shift shrinkage and warpage measurably.
How do polymer shrinkage and warpage impact achievable tolerances after moulding and cooling?
Polymer shrinkage reduces part dimensions as the melt cools, so moulds require oversize allowances. Typical volumetric shrinkage ranges from about 0.5% to 2.5%, varying by resin grade, fibre content, and wall thickness. Warpage occurs when shrinkage becomes non-uniform, creating bending and twist that can exceed ±0.1 mm on thin, long features. Tight tolerances need controlled packing pressure, uniform cooling, and stable mould temperature.
What tolerance ranges are realistic for standard injection moulding versus high-precision moulding?
Standard injection moulding typically achieves ±0.10 to ±0.50 mm on most dimensions, with tighter control on smaller features. High-precision moulding can hold ±0.01 to ±0.05 mm when tooling, process control, and metrology support it. Expect tighter tolerances to increase cycle time, inspection effort, and scrap risk, especially on large parts.
How do mould design choices such as gate location, venting, and cooling layout affect precision?
Gate location controls flow length and weld lines, affecting shrinkage and dimensional drift; moving a gate by 5–10 mm can shift sink risk on thin ribs. Venting (typically 0.02–0.05 mm deep) prevents burn marks and short shots that distort edges. Cooling layout drives uniform solidification; a 5–10°C mould temperature imbalance often increases warpage and tolerance scatter.
Which inspection and measurement methods verify tolerances for injection moulded parts?
Manufacturers verify tolerances using callipers and micrometers for basic dimensions (typically ±0.01–0.02 mm resolution), coordinate measuring machines (CMMs) for 3D geometry (often ±2–5 µm accuracy), and optical comparators or vision systems for profiles. They also use go/no-go gauges for fast checks and 3D scanning to compare parts against CAD.